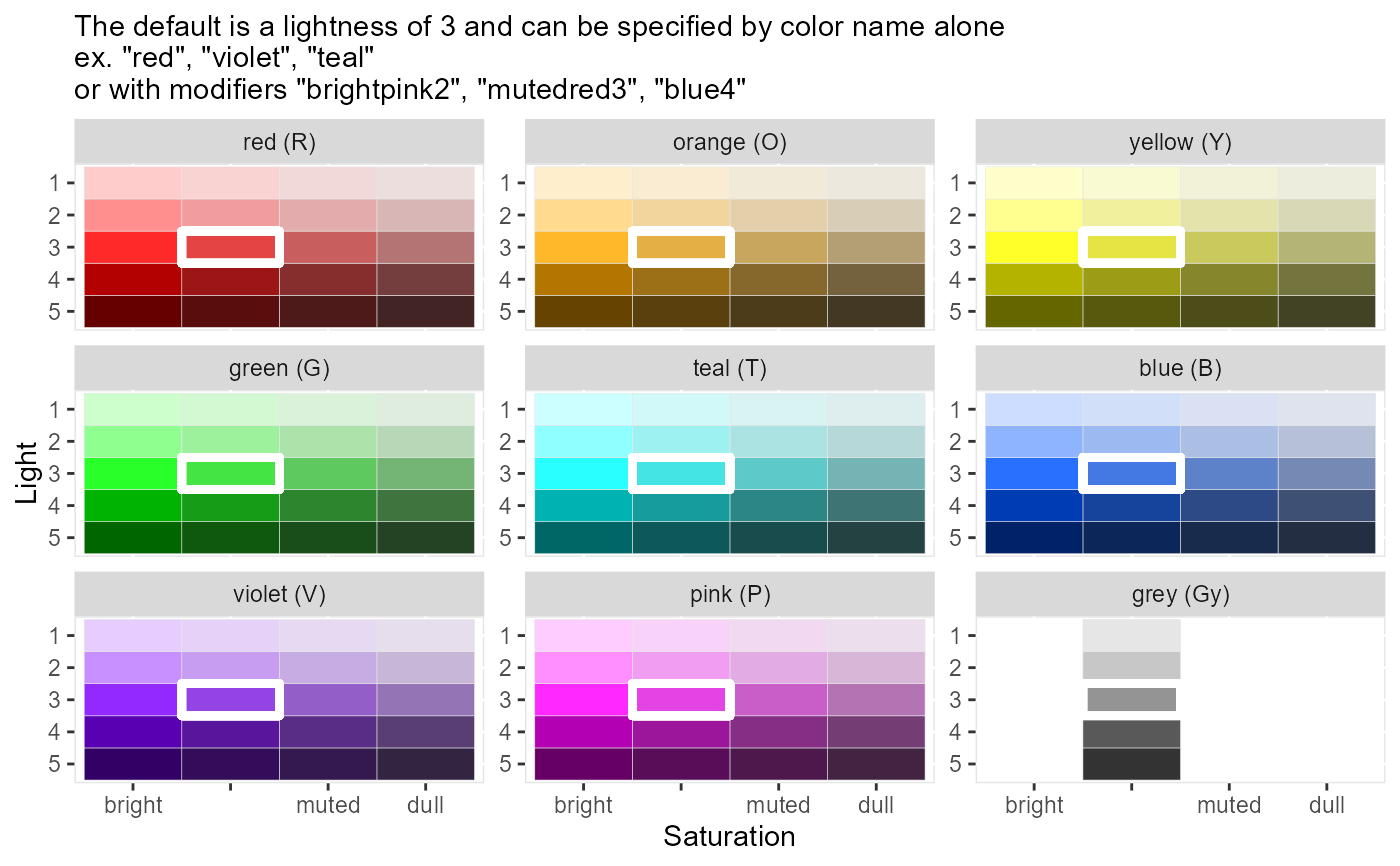
Plots all available color values.
Usage
show_colors(labels = FALSE)
Arguments
- labels
logical TRUE (default) will plot the color with color names, FALSE will plot the colors only
Value
Returns a ggplot object
Details
Labels can be added by using the argument labels = TRUE
Examples
show_colors()