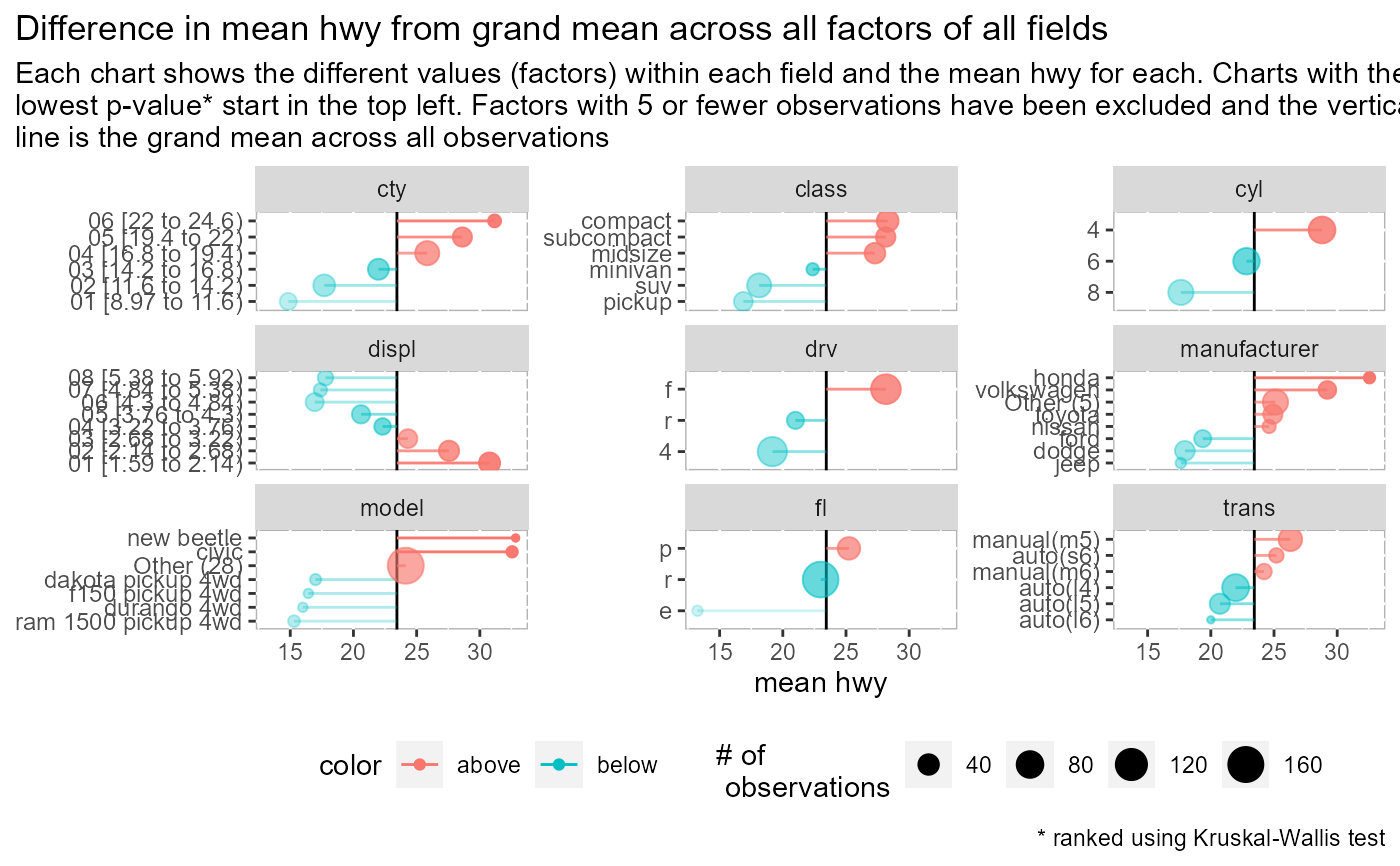
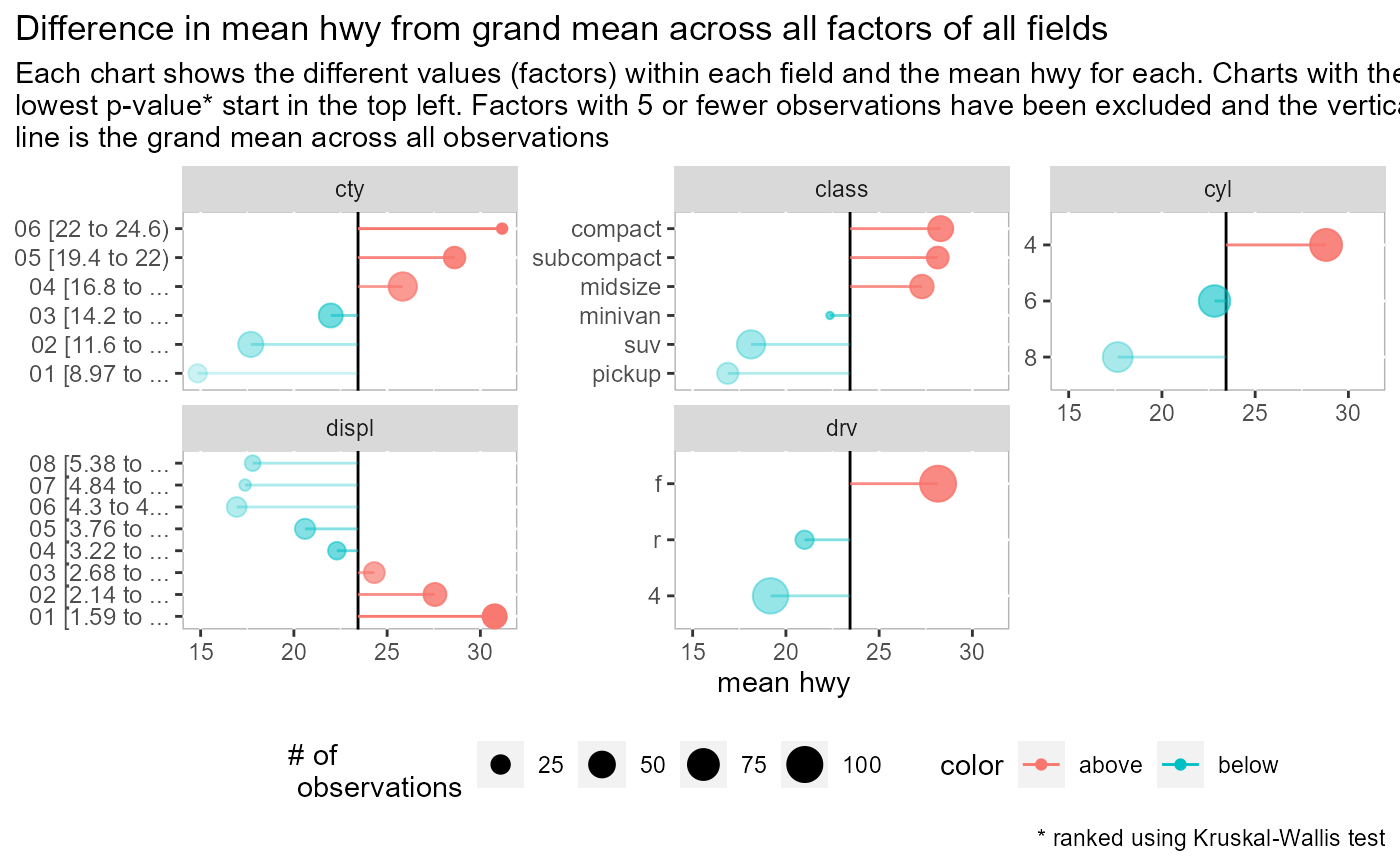
Visualize difference from avg. by factor (lollipop)
plot_deltas(df, dv, ..., trunc_length = 100, return_data = FALSE, n_field = 9)
Arguments
| df |
dataframe to evaluate |
| dv |
dependent variable to use (column name) |
| ... |
Arguments passed on to refactor_columns
split_onvariable to split data / group by id_colfield to use as ID n_catfor categorical variables, the max number of unique values
to keep. This field feeds the forcats::fct_lump(n = ) argument. collapse_byshould n_cat collapse by the distance to the grand
mean "dv" leaving the extremes as is and grouping factors closer to the
grand mean as "other" or should it use size "n" n_quantilefor numeric/date fields, the number of quantiles used
to split the data into a factor. Fields that have less than this amount
will not be changed. n_digitsfor numeric fields, the number of digits to keep in the breaks
ex: [1.2345 to 2.3456] will be [1.23 to 2.34] if n_digits = 2 avg_typemean or median ignore_colscolumns to ignore from analysis. Good candidates are
fields that have have no duplicate values (primary keys) or fields with
a large proportion of null values |
| trunc_length |
number of charcters to print on y-axis |
| return_data |
When TRUE will return data frame instead of a plot. |
| n_field |
How many fields/facets should the plot return. |
Examples

