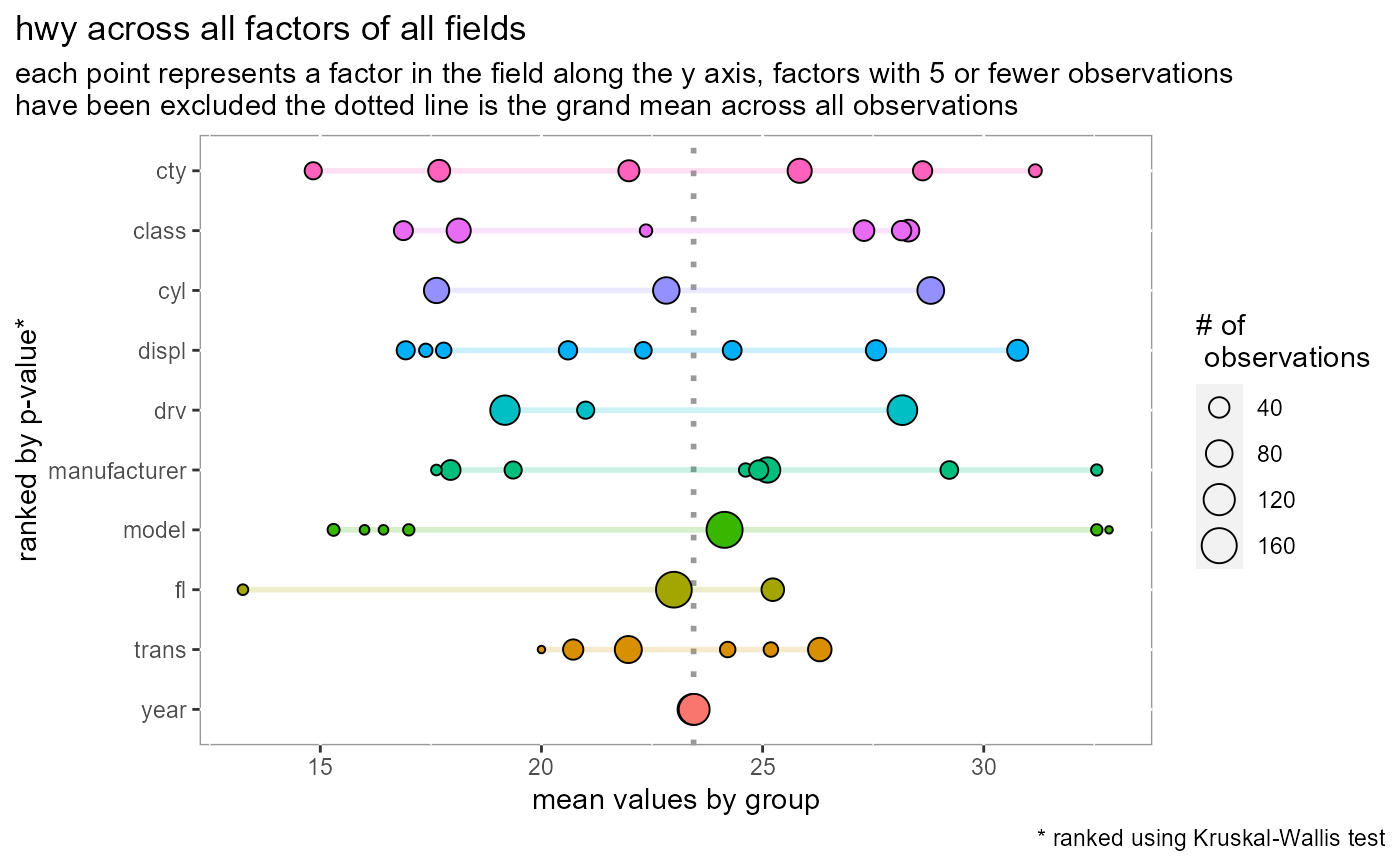
Visualize spread of avg. values among all factors for all variables
Source:R/plot-spread.R
plot_spread.RdVisualize spread of avg. values among all factors for all variables
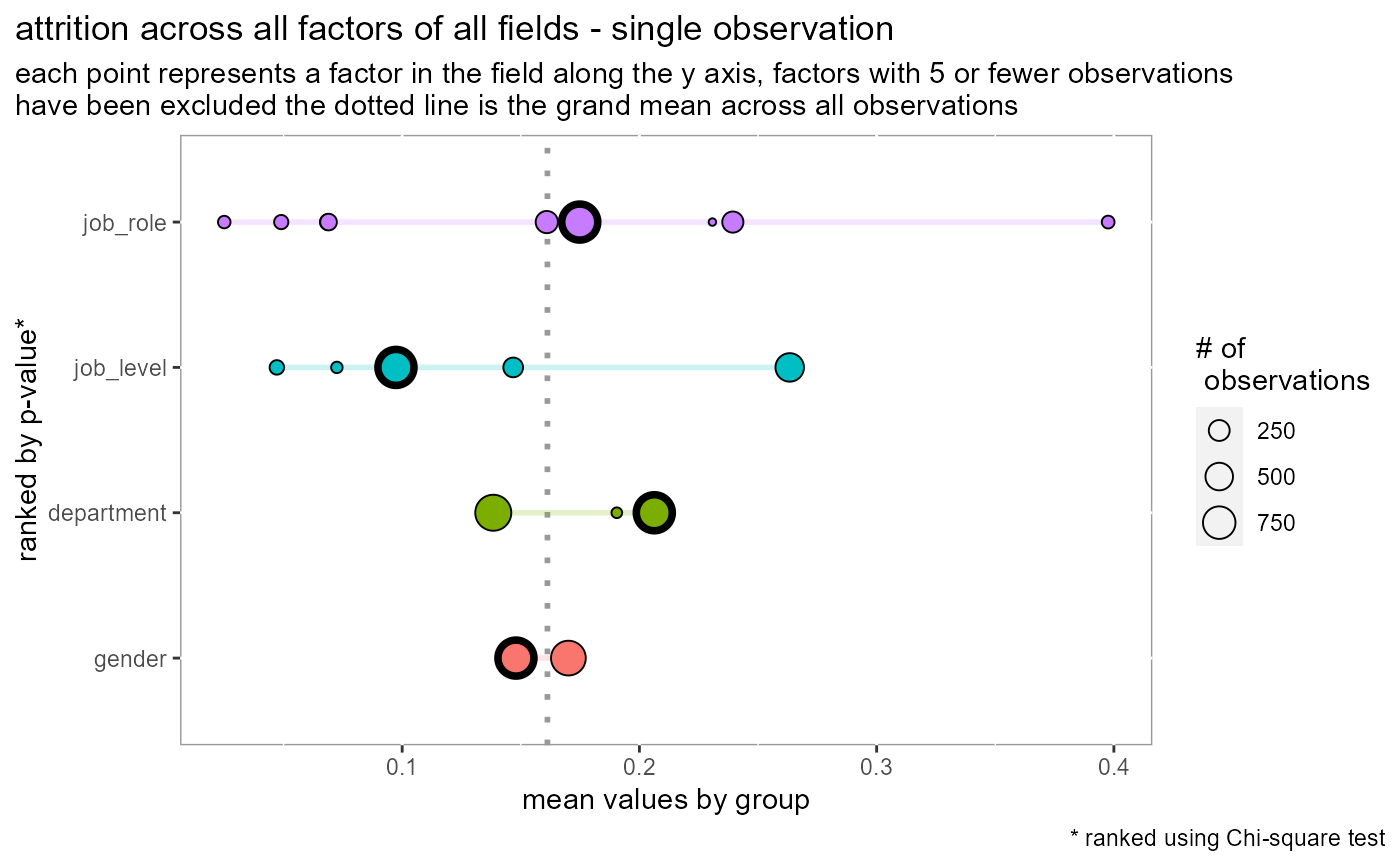
Visualize variation and logic for a single observation
plot_spread(df, dv, ...)

plot_spread_single_obs(df, dv, ..., labels = FALSE, isolate_id = 1)

plot_spread_interactive(...)
Arguments
| df | dataframe to evaluate |
|---|---|
| dv | dependent variable to use (column name) |
| ... | Arguments passed on to
|
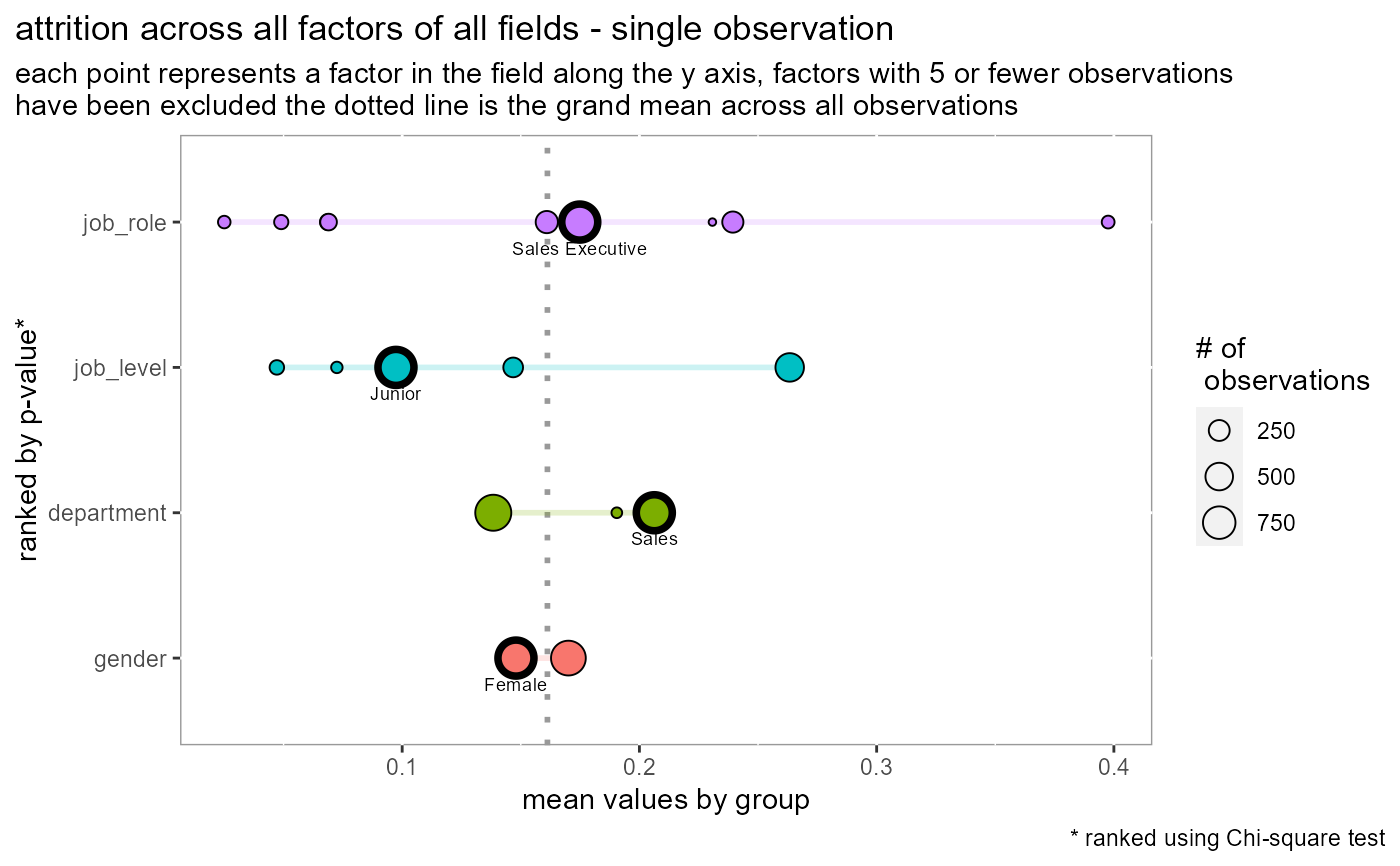
| labels | when TRUE will show the labels of the factor levels outlined in the plot |
| isolate_id | the unique id from the field specified in
|
Functions
plot_spread_single_obs: highlight a single observationplot_spread_interactive: utilizing ggplotly
Examples
plot_spread_single_obs(df = employee_attrition[,1:5], dv = attrition)plot_spread_single_obs(df = employee_attrition[,1:5], dv = attrition, labels = TRUE)#> Warning: `gather_()` was deprecated in tidyr 1.2.0. #> Please use `gather()` instead.


