The data has box office sales, audience ratings, and release dates for each Pixar film
Format
A tibble with 22 rows and 10 columns:
- order
order of release
- film
name of film
- release_date
date film premiered
- year
the year the film premiered
- run_time
film length in minutes
- film_rating
rating based on Motion Picture Association (MPA) film rating system
- rotten_tomatoes
score from the American review-aggregation website Rotten Tomatoes; scored out of 100
- metacritic
score from Metacritic where scores are weighted average of reviews; scored out of 100
- bo_domestic
box office gross amount in U.S. dollars (millions) for U.S. and Canada
- bo_intl
box office gross amount in U.S. dollars (millions) for other territories
Examples
pixar_films
#> # A tibble: 22 × 10
#> order film release_…¹ year rating run_t…² rotte…³ metac…⁴ bo_do…⁵ bo_intl
#> <int> <chr> <date> <dbl> <chr> <dbl> <dbl> <dbl> <dbl> <dbl>
#> 1 1 Toy St… 1995-11-22 1995 G 81 100 95 192. 182.
#> 2 2 A Bug'… 1998-11-25 1998 G 95 92 77 163. 200.
#> 3 3 Toy St… 1999-11-24 1999 G 92 100 88 246. 252.
#> 4 4 Monste… 2001-11-02 2001 G 92 96 79 290. 342.
#> 5 5 Findin… 2003-05-30 2003 G 100 99 90 340. 531.
#> 6 6 The In… 2004-11-05 2004 PG 115 97 90 261. 370.
#> 7 7 Cars 2006-06-09 2006 G 117 74 73 244. 218.
#> 8 8 Ratato… 2007-06-29 2007 G 111 96 96 206. 417.
#> 9 9 WALL-E 2008-06-27 2008 G 98 95 95 224. 298.
#> 10 10 Up 2009-05-29 2009 PG 96 98 88 293 442.
#> # … with 12 more rows, and abbreviated variable names ¹release_date, ²run_time,
#> # ³rotten_tomatoes, ⁴metacritic, ⁵bo_domestic
library(ggplot2)
headline(
x = min(pixar_films$run_time),
y = max(pixar_films$run_time),
headline =
"The shortest film was {delta} minutes less than the longest film ({orig_values} minutes)"
)
#> The shortest film was 37 minutes less than the longest film (81 vs. 118 minutes)
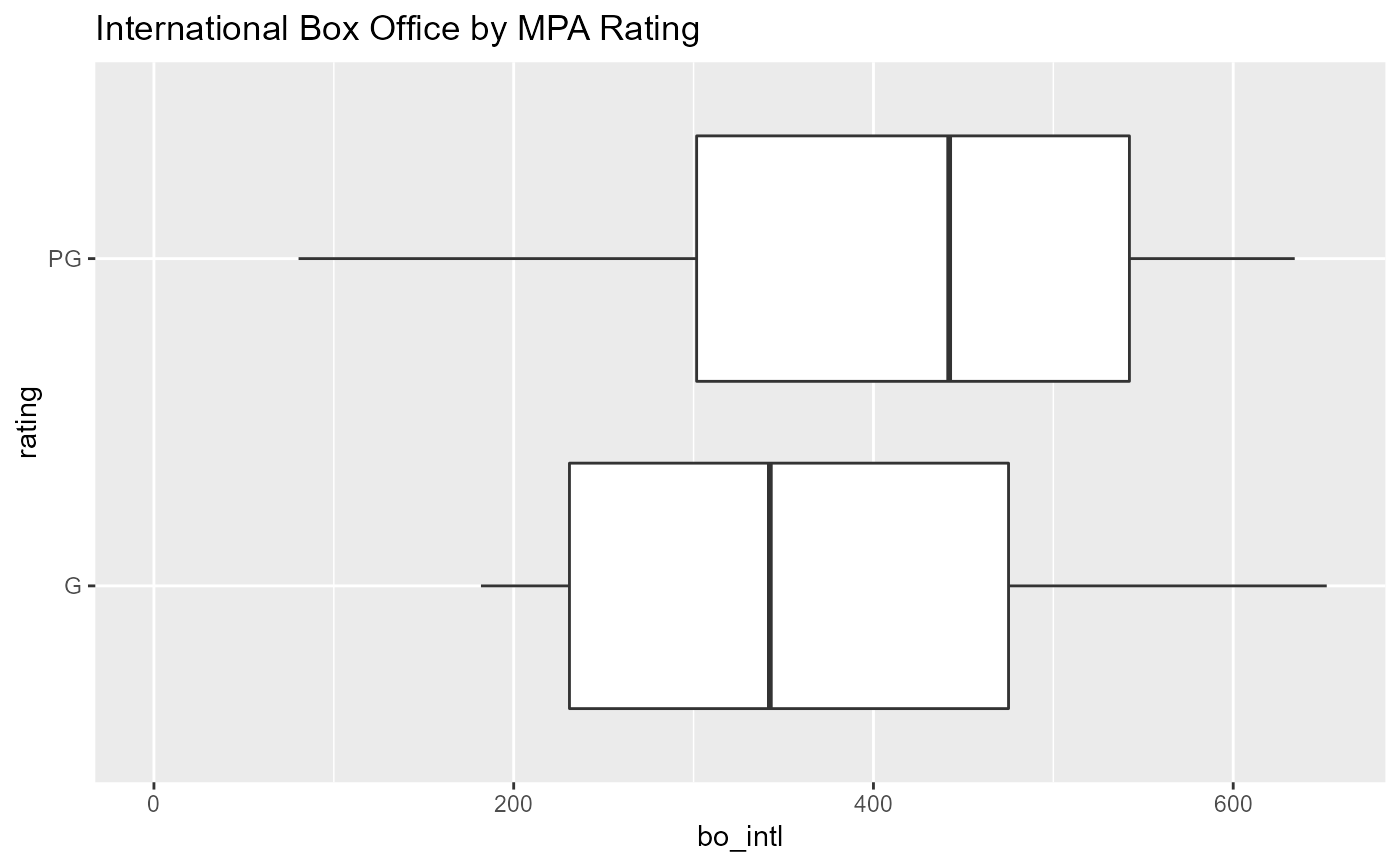
ggplot(pixar_films, aes(bo_intl, rating)) +
geom_boxplot() +
xlim(0, NA) +
labs(title = "International Box Office by MPA Rating")
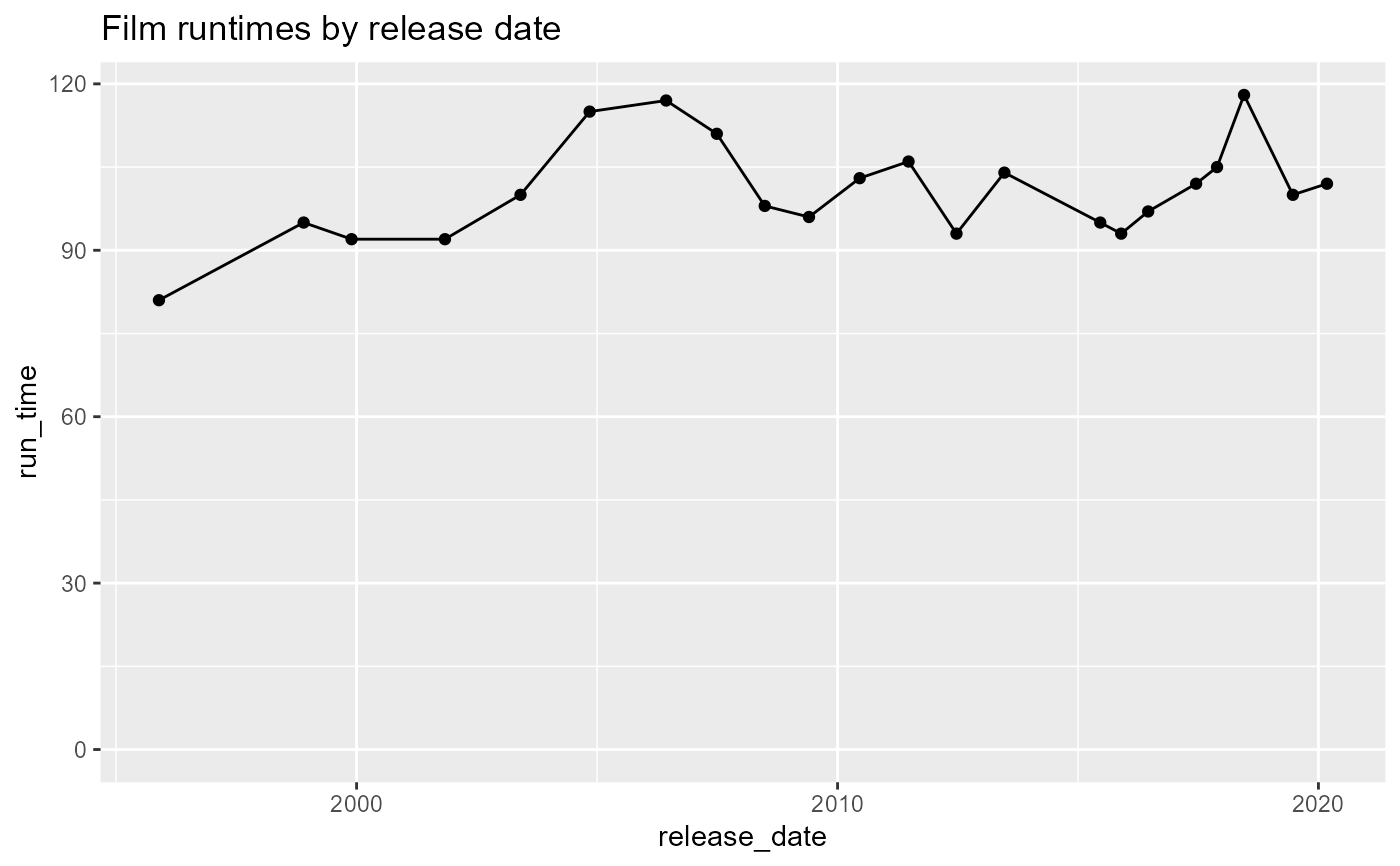
 ggplot(pixar_films, aes(release_date, run_time)) +
geom_line() +
geom_point() +
ylim(0, NA) +
labs(title = "Film runtimes by release date")
ggplot(pixar_films, aes(release_date, run_time)) +
geom_line() +
geom_point() +
ylim(0, NA) +
labs(title = "Film runtimes by release date")
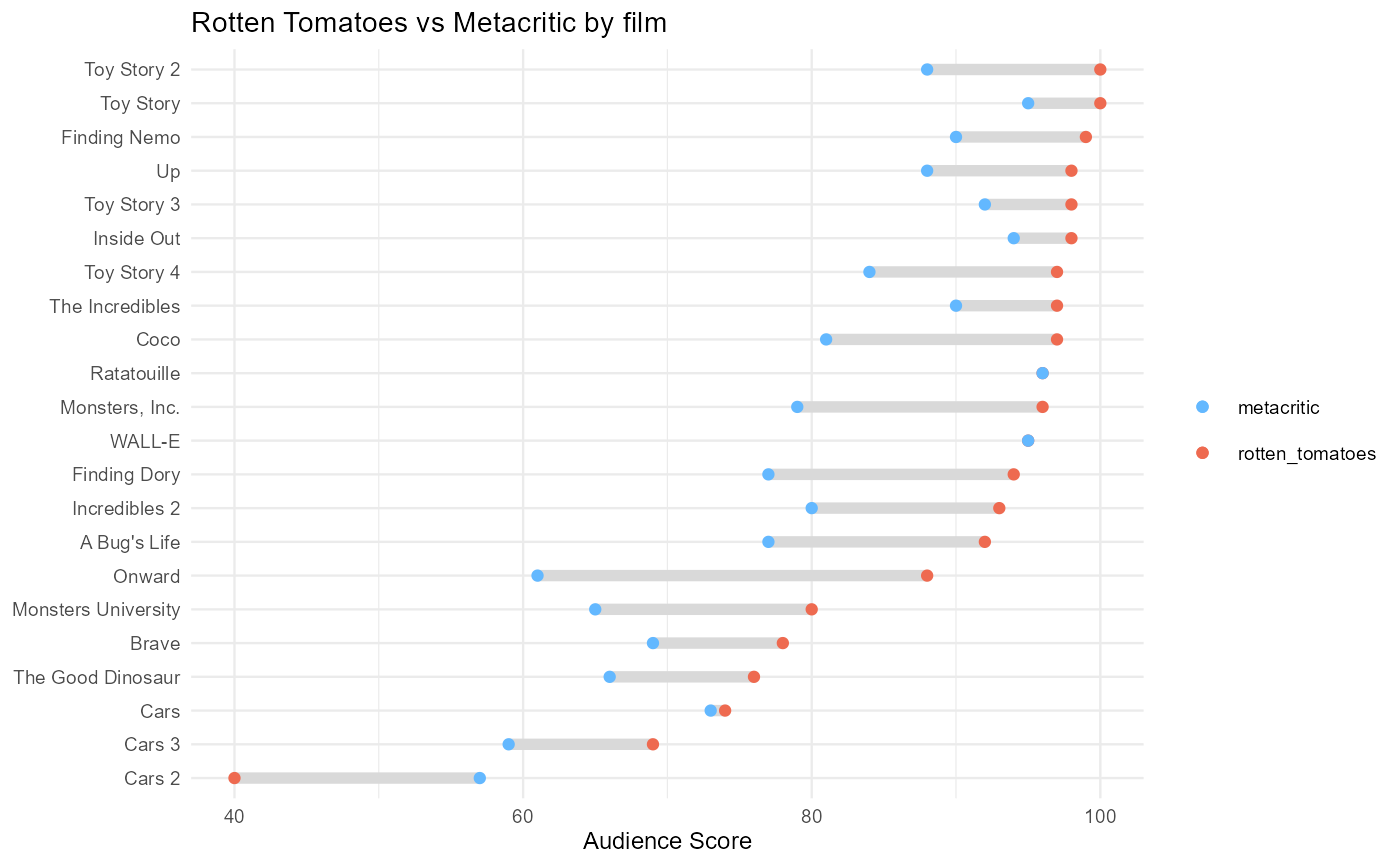
 ggplot(pixar_films, aes(y = reorder(film, rotten_tomatoes))) +
geom_linerange(aes(xmin = rotten_tomatoes, xmax = metacritic), size = 2, color = "grey85") +
geom_point(aes(x = rotten_tomatoes, color = "rotten_tomatoes")) +
geom_point(aes(x = metacritic, color = "metacritic")) +
scale_color_manual(values = c("steelblue1", "coral2")) +
theme_minimal(base_size = 9) +
labs(
title = "Rotten Tomatoes vs Metacritic by film",
color = NULL,
y = NULL,
x = "Audience Score"
)
ggplot(pixar_films, aes(y = reorder(film, rotten_tomatoes))) +
geom_linerange(aes(xmin = rotten_tomatoes, xmax = metacritic), size = 2, color = "grey85") +
geom_point(aes(x = rotten_tomatoes, color = "rotten_tomatoes")) +
geom_point(aes(x = metacritic, color = "metacritic")) +
scale_color_manual(values = c("steelblue1", "coral2")) +
theme_minimal(base_size = 9) +
labs(
title = "Rotten Tomatoes vs Metacritic by film",
color = NULL,
y = NULL,
x = "Audience Score"
)